This is a small guide on how to observe memory allocations of a process. When carrying out a change it is not only of interest if all test cases still pass, if the benchmarks are faster but it is also important to figure out if there was a change in storage (stack and RAM) requirement.
If you are using the GNU libc it is likely you have a /lib/libmemusage.so installed on your system. This library can be preloaded using LD_PRELOAD and will intercept calls to malloc,free,realloc and various other calls. In short it will trace memory allocations for you. The limitation of that tool is that it will not tell you how much memory the kernel actually mapped, anything about memory fragmentation, etc.
To use libmemusage all you have to do is to prepend MEMUSAGE_OUTPUT=mytrace and LD_PRELOAD=/lib/libmemusage.so to your application. This will instruct the library to write out a trace to the mytrace file.
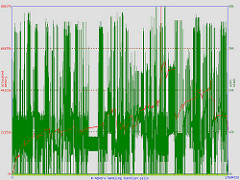
This trace file can be converted to a graph using the memusagestat utility. It is not installed by most GNU distributions and can be either build from the glibc sources or from the QtWebKit performance measurement utilities. Using memusagestat -o output.png mytrace an image with memory allocations and stack usage like the one at the end of this post will be created. The redline is the heap usage, the green one is the stack usage of the application. The x-scale is the number of allocations.
NOTES: As of today the graph creation with the x-Axis being the time is broken as the generated trace file has some issues, I’m looking into the problem but it will take some more days.